House of Cards
9/2/2016
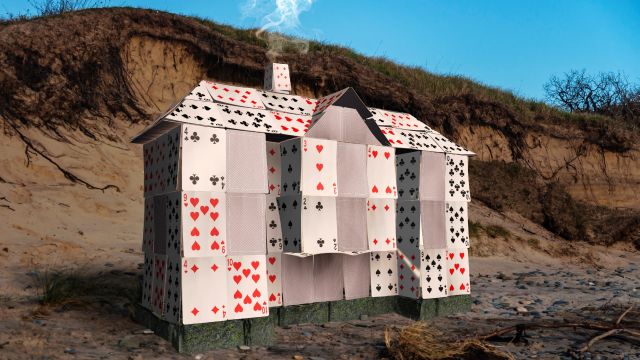
Even after nearly a decade, the effects of the U.S. housing bubble have yet to leave the market. Participants have decided they would rather play Go Fish than a high-stakes game of poker.
While the broader economy continues to reestablish itself, millions of current, former and potential homeowners have struggled to determine the importance of property and define what it means to have a household. This period of uncertainty has created a cautious housing market that shuns bubble-like excess.
However, the market avoiding a return to a bubble doesn’t mean things are “normal”. The current mix of housing data from the U.S. Census Bureau makes things seem stranger than ever as buyers and sellers continue to reconcile their post-2008 shell shock.
Surprising Lows
Since the housing bubble burst, the percentage of Americans that own homes has plummeted. The reported homeownership rate sits at 62.9 percent for June 2016, a long way from its peak of 69.2 percent in 2004. That figure ties the record low set in 1965 and may continue to drop in the coming years.
Accompanying the low ownership rate are low sales of existing homes. While existing home sales have strongly rebounded from the bottom of the crash (2010), the numbers have begun to flatten or slowly decline in most areas. In July 2016, sales occurred at a seasonally adjusted annual rate of 5.39 million units, a 1.6 percent decrease from a year before. Analysts did not expect existing homes sales to return to peak 2005 rates (over 7 million units annually) for several more years; however, the expectation was that the improving economy would drive steady sales growth.
Continued Growth
Despite the drops, it’s difficult to argue the housing market is getting worse. There are clear signs housing’s expansion and improvement.
Home prices have shown the most positive growth, advancing an average of 5-10 percent annually since 2012, with a 5.7 percent increase from June 2015 to June 2016. According to price indexes, many homes in the United States have nearly recovered the nominal prices they held before the crisis. (Adjusted for inflation, these prices are still far below their peak values.)
Although existing home sales have stayed low, sales of new homes are surging. Seasonally adjusted sales of new homes have climbed to their highest level since October 2007, increasing in all but two of the past 12 months and growing more than 31 percent from July 2015 to July 2016. Because developers are no longer willing to keep excess inventory, availability of completed homes has been limited and more buyers are turning to properties that are still empty or under construction.
Does this Make Any Sense?
Like any other market, housing is driven by supply and demand. Unhinged demand during the housing bubble created huge valuations, even though the supply of properties exceeded the number of families that could actually afford to live in them. Today, demand is low, but the supply of available homes has slipped even lower. With interest rates at historic lows, sellers can push prices higher without buyers seeing any significant change to their monthly mortgage payments.
Most markets correct prices quickly, but housing changes slowly; the decision to buy a property is not made overnight, and houses take several months to plan and build. Although rising interest rates and the continued construction of new homes are expected to increase supply, decrease demand and slow price growth, there are still millions of people that may return to homeownership and boost demand as the memory of the bubble fades.
No one knows what the future holds for housing. While the reports and data paint an odd picture of things as they are now, the recovery is still at a crossroads. We will just have to be patient as the market finds its way to a “new normal”.