Commentary – 2023 3rd Quarter
7/13/2023

“I suppose if we couldn’t laugh at things that don’t make sense, we couldn’t react to a lot of life.”
- Bill Watterson, Calvin and Hobbes
A Surprising First Half
Last year, the performance of the stock market could be divided into two halves. In the first six months came a crash—shares shed over 20% of their value by the end of June 2022. They then wiggled around, surging to relative highs in August, when it seemed that inflation had been vanquished. But October brought new lows when it became clear that it hadn’t. By December they returned to where they had been in June.
This year, so far, has been a mirror of the events of 2022. The S&P 500 had climbed by roughly 16% at the close on June 30th, helped by cooling inflation and a surge of excitement about what artificial intelligence might mean for productivity and corporate profits. It is more than 20% above last October’s lows, making this, technically, a new bull market.
It might be tempting for investors to try to put the chaos of 2022 behind them and return to the winning strategy of 2021: loading up on American tech stocks. But it is worth remembering the fragile foundations the rally rested on. A new paper by AQR Capital Management adds to the chorus of concern about lofty valuations of stocks[1].
“American outperformance against shares in other rich countries, which has been the norm for many years, has been largely driven by soaring valuations. Of the 4.6% premium that American stocks have commanded over three decades, some 3.4 percentage points are explained by rising price-to-earnings ratios in America. Just 1.2 points comes from fundamentals, such as higher earnings. Outperformance because of strong fundamentals might be repeatable. But winning simply because people were willing to pay more for the same fundamentals is probably not.”
There are plenty of reasons to think that the second half of 2023 might complete the mirror image of last year, with uneasy ups and downs cancelling each other out, or perhaps worse.
Headline inflation has eased, but the sticky “core” element (excluding food and energy) has not eased nearly as much. Investors expect inflation to fall gently, with little further monetary tightening. This may prove too optimistic.
Much of the tech excitement is forward-looking enthusiasm. For it to be proven correct, AI must revolutionize businesses. A flat second half, in these circumstances, might be the best we can expect.
However, a consensus narrative appears to be absent. While we tend to share the skepticism about rising stock valuations, there are competing indicators which have created an uncertain outlook.
Contradiction #1: The Misery Index vs. Consumer Sentiment
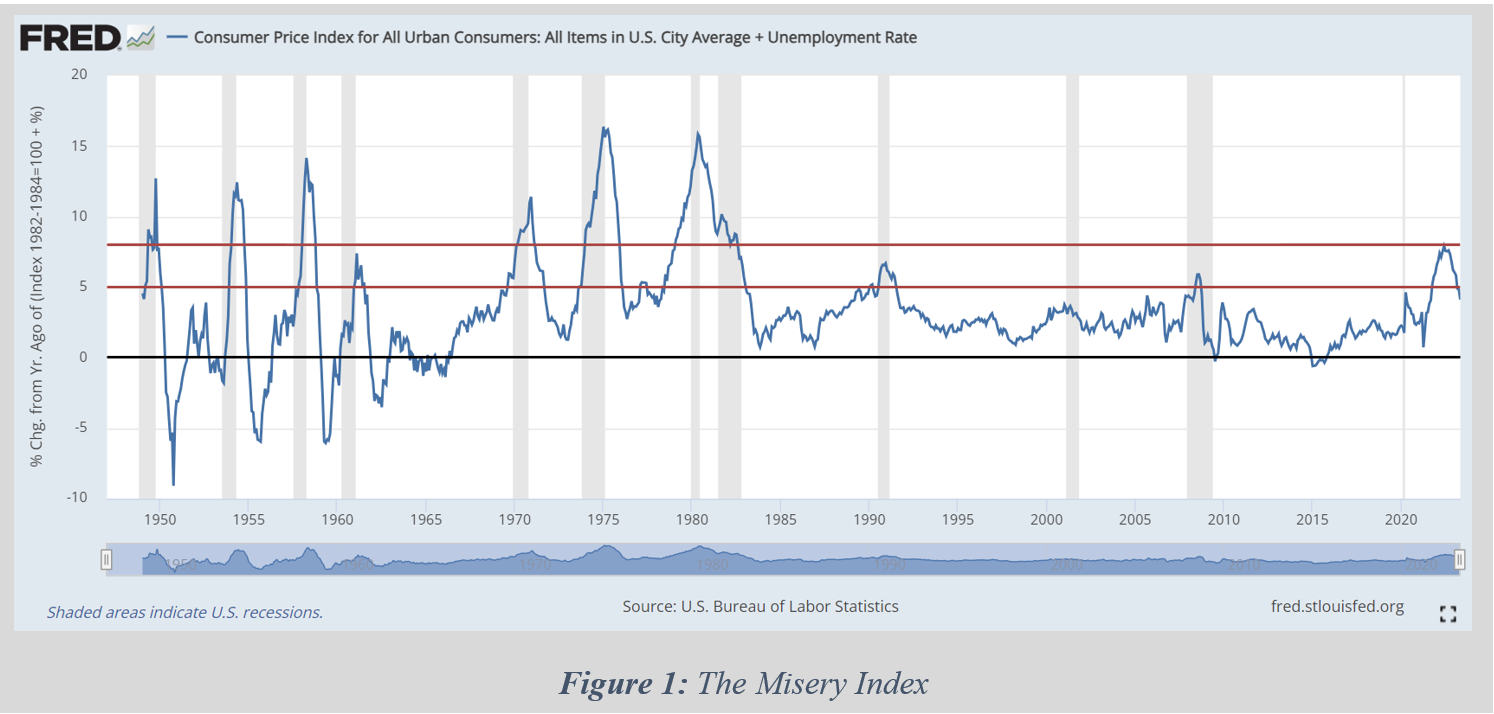
Popularized during the hyperinflation of the 1970s, the so-called “Misery Index” attempts to chart how well the Federal Reserve is meeting their dual mandate of targeted inflation and full employment. The inflation target is easy: 2%. Full employment is a bit more of a moving target, but most economists agree that this means an unemployment rate between 3-6%. The Misery Index simply adds these two figures.
Therefore, a Misery Index reading of under 5% means relative ease for the consumer, while a reading over 8% means relative difficulty. The latest reading in May 2023 was 4.11%.
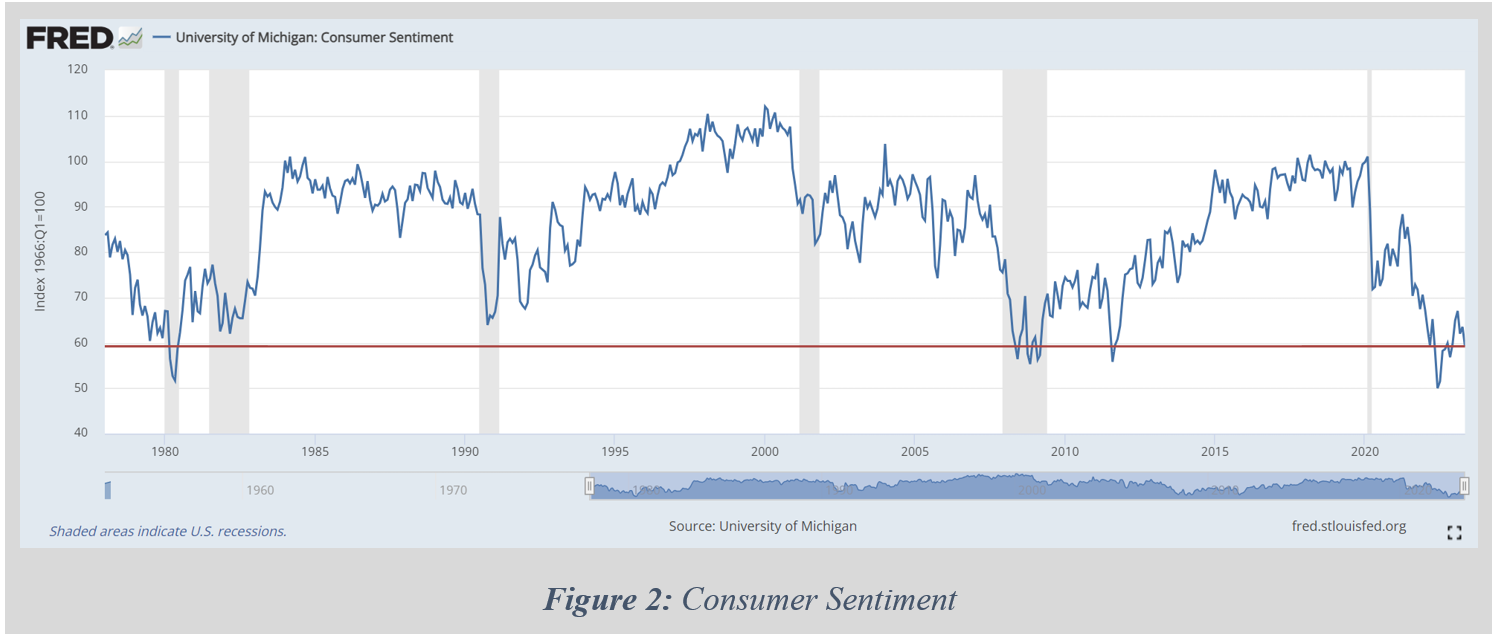
Compare this to the Consumer Sentiment Index—a survey published monthly by the University of Michigan. It is the longest running of its kind in the U.S., started in the first quarter of 1966. Each month, at least 500 telephone interviews are conducted of a contiguous United States sample asking consumers about their confidence in the economy. Fifty core questions are asked and tabulated.
Over the last 50 years, the Misery Index is currently lower (i.e., more accommodative) than it has been 83% of the time, but Consumer Sentiment is currently lower (i.e., less optimistic) than it has been 92% of the time[2]. The bottom line is that, despite encouraging data, the American consumer is not convinced that the Federal Reserve has successfully navigated the economy away from a recession.
Contradiction #2: VIX vs. MOVE
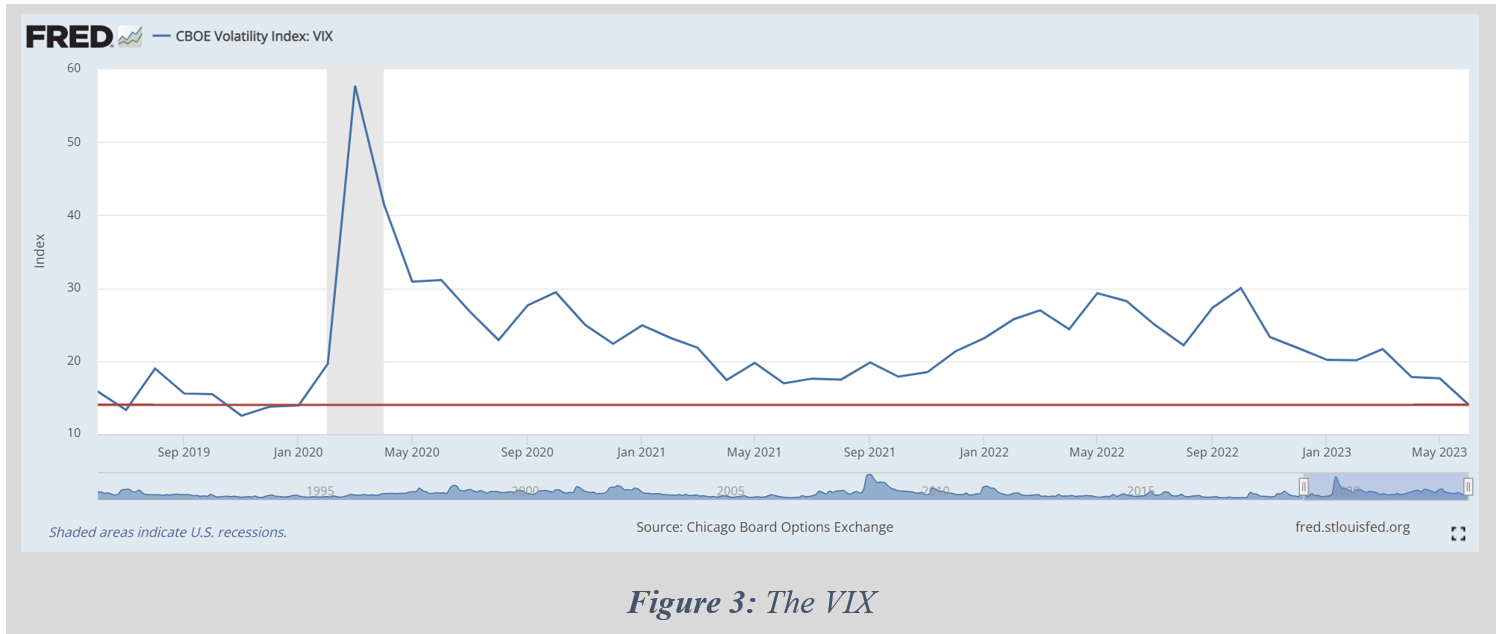
The CBOE Volatility Index (VIX) is a real-time index that represents the market’s expectations for the relative strength of near-term price changes of the S&P 500. It generates a 30-day forward projection of volatility, which is often used to gauge market sentiment, and in particular the degree of fear among market participants.
The current VIX reading is back to pre-Covid levels during an historically placid market. This suggests that stock investors are currently extremely bullish.
In contrast is the Merrill Lynch Option Volatility Estimate Index (MOVE), which is a crucial gauge of interest rate volatility in the U.S. Treasury market. The index measures the implied volatility of U.S. Treasury options across various maturities. Like the VIX index’s role in the stock market, the MOVE index can be considered the “fear gauge” for bond investors.
The current MOVE reading has only been met twice over the last 25 years—during the Great Recession and during the tech bubble in the early 2000s. Bond investors are currently extremely bearish.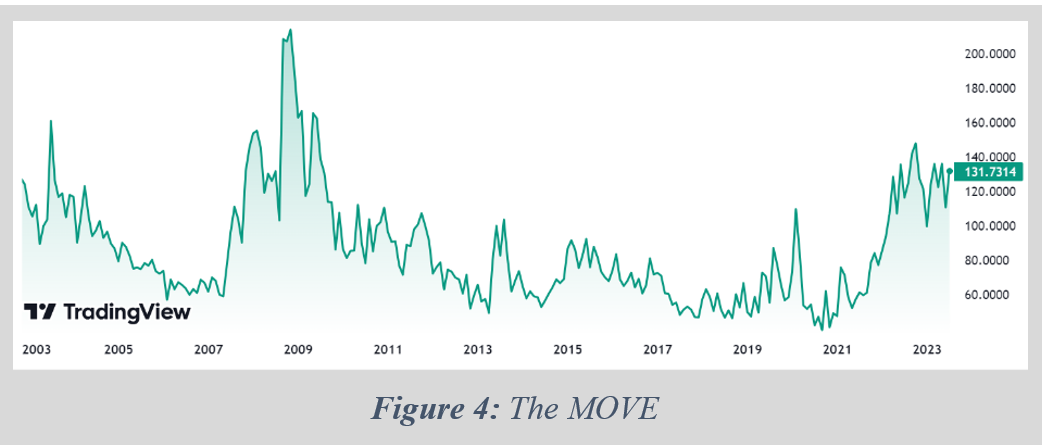
In some sense, this is not necessarily surprising. Stock investors tend to be much more risk tolerant than bond investors. The latter are the more calculated, conservative bunch who may sit on the sidelines while the S&P 500 doubles, triples, or more.
What is atypical is the degree to which each of these camps appear to be misaligned—somebody is making a bad bet.
The Planning Capital Take
While we tend share the skepticism of bond investors and the American consumer, bullish indicators in the stock market are difficult to ignore.
There are two major pieces protecting against a recession right now: the cyclical sectors are far from being overextended, and the labor market is strong. The housing market is one of the more pivotal sectors to monitor, especially leverage, when markets are coming to the end of a cycle. Right now, cash purchases are the highest percentage of home sales in the last decade. On the labor market front, job openings are at an all-time high. This pent-up demand for labor means that growth should fade slowly.
 Ultimately, inflation should settle in around 3% to 3.5% and will likely start declining further in the second half of 2024. This will likely be met with lower interest rates by then. It is possible that there will be another one or two rate hikes in between, but unlikely that we will see the double-digit inflation figures again anytime soon.
However, there are a few leading indicators which give us pause. The personal savings rate of Americans has plunged, and revolving credit has doubled. This suggests that households are living beyond their means and may mean a pullback in consumer spending is on the horizon (especially considering weak consumer sentiment).
Second, the capital spending intentions of corporate America is plummeting. Banks are seeing the demand for loans fall through the floor because new investment is being halted. A slowdown in this type of activity almost certainly means that slow growth is the best we can expect.
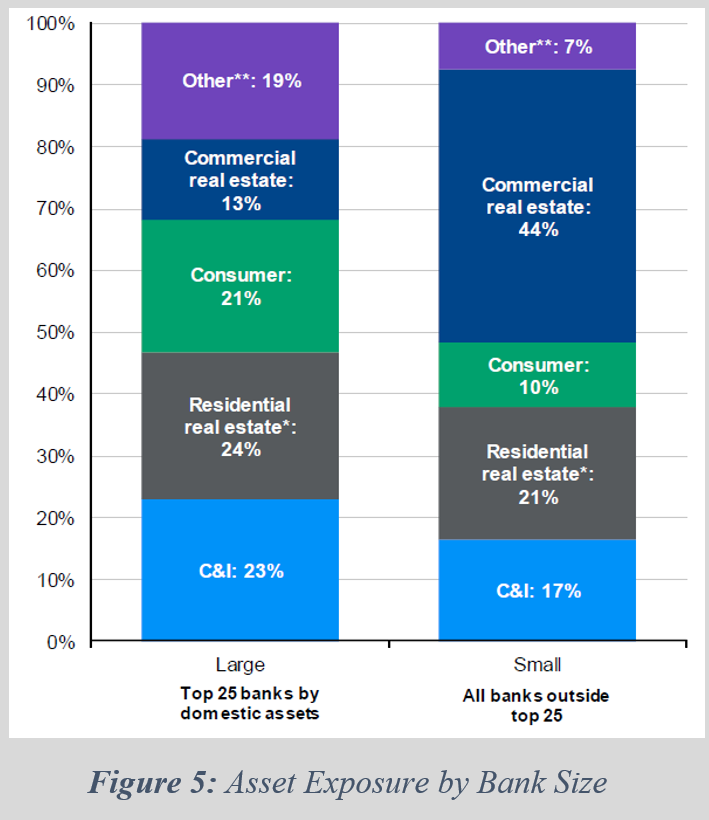
Third, small and mid-sized banks have a comparatively large amount of exposure to commercial real estate (See: Figure 5). While office space is the main issue, and some banks will be immune, this will likely be the next shoe to drop in the “slow rolling crisis” we wrote about last quarter.
Lastly, we are concerned about stock valuations. The market capitalization of the top 10 stocks in the S&P 500 has reached an all-time high, but the amount of earnings contributed to the index from those same 10 stocks has plummeted (See: Figure 6). Essentially, this means that the rally has been sentiment driven and not fundamentals driven. Either profits need to catch up, or prices need to “catch down.” We currently have a hard time making the case for the former.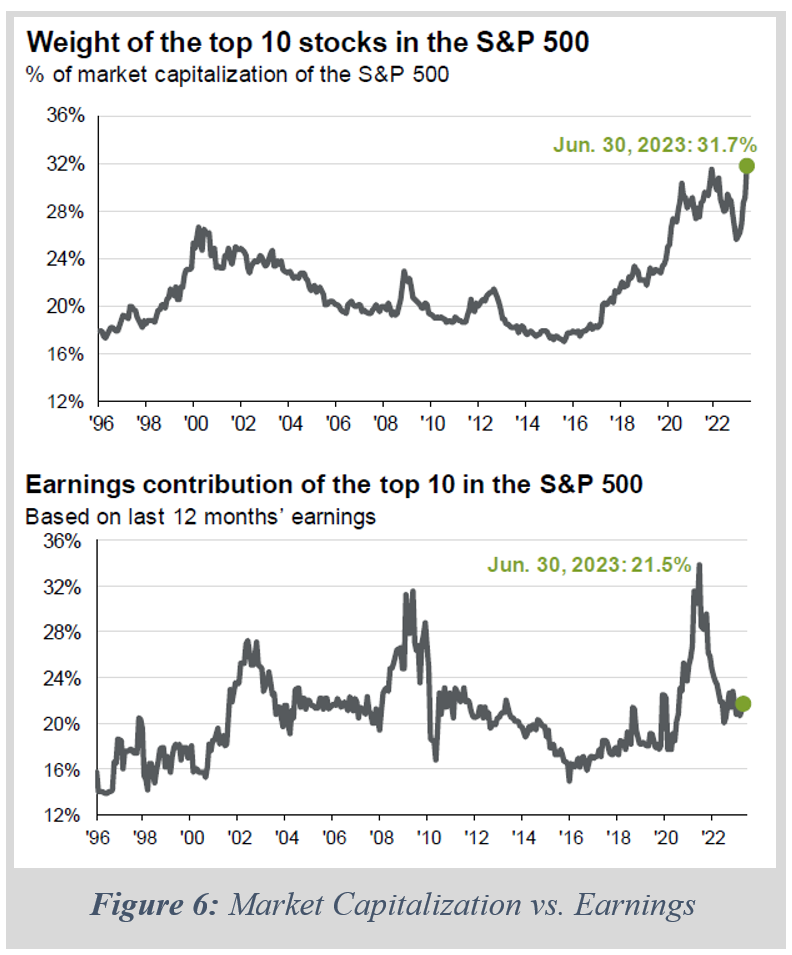
Therefore, it is our contention that a recession has merely been delayed, but the case for a mild recession appears more feasible. This would mean the stock market may retreat from its highs due to weaker corporate earnings and a decrease in capital expenditure. But we are less concerned about runaway inflation, a spike in unemployment, a major housing market crisis, or other catastrophic scenarios.
We hope you enjoyed our comments. If you have any questions, please do not hesitate to contact us. We welcome the opportunity to discuss our thoughts in greater detail. Thank you for your continued confidence in Planning Capital.
Sincerely,
The Planning Capital Team
Author
Daniel B. Brady, MBA, CFP® │ Partner
Contributors
Richard W. Bell, Jr., CKA® │ Partner
David A. Emery, MBA, CDFA®, CFP® │ Senior Financial Planner
Jay D. Ahlbeck, CLU®, ChFC® │ Senior Financial Planner
Paul C. McClatchy, MBA, CFP® │ Senior Financial Planner
[1] Graphic Detail, “Can America’s stock market rally last?” The Economist, June 30, 2023
[2] David Kelly, “Q3 Guide to the Markets,” JP Morgan Asset Management, June 30, 2023