Commentary – 2021 2nd Quarter
4/21/2021

“Be fearful when others are greedy and greedy when others are fearful.”
- Warren Buffett
Goldilocks and the Three (Market) Bears
Jamie Dimon, CEO of JPMorgan Chase, always publishes an annual letter at the end of the first quarter. This year, it clocks in at a whopping 66 pages of material, so dense it makes a roll of quarters seem like balsa wood. But amidst his longwindedness emerged a phrase that has already been copied by journalists from The Wall Street Journal to Bloomberg to Barron’s—the Goldilocks economy.
Like all cautionary tales for children, the moral of Goldilocks has evolved over the years. The “rule of three” was initially less relevant as the story was meant to deter youngsters from the slippery slope of thievery and intrusion. Today, of course, Goldilocks has become synonymous with the “too hot, too cold, and just right” ideology.
The “too hot” economy would rebound, which is great, but perhaps at a jarring pace. Inflation could take off quickly and central banks would be forced to raise rates sooner and more aggressively.
Markets appear to be assuming that the COVID-19 pandemic is all but beaten. The “too cold” economy would challenge this thesis with still-high unemployment numbers, lagging corporate earnings, and no inflation. Neither of these results would bode well for the stock market.
Somewhere in the middle, the “just right” economy exists. Mr. Dimon appears to be optimistic about this outcome[1] –
“The economy has emerged from the recession created by the coronavirus pandemic better than expected, and there is reason to believe good times can continue into 2023, thanks to swift fiscal and monetary policy actions and the increasing rollout of vaccines.
I have little doubt that with excess savings, new stimulus savings, huge deficit spending, more quantitative easing, a new potential infrastructure bill, a successful vaccine and euphoria around the end of the pandemic, the U.S. economy will likely boom. We do not know what the future holds, but it is possible that we will have a Goldilocks moment.”
He also said government spending may have lasting positive economic effects, beyond the next two years, if the outlays are done in a disciplined manner that provides greater economic opportunity.
The logic is sound, and the metaphor of Goldilocks is compelling. It is also true that expansionary fiscal and monetary policy tend to correlate with, well, expansion. So, it would stand to reason that a vaccine-led economic recovery should create feelings of optimism.
For the most part, investors are technically optimistic. Almost every major survey, such as the American Association of Individual Investors Sentiment Survey and Investor’s Business Daily Optimism Index, have investor optimism at 12-month highs. This is somewhat misleading, however, because none of the surveys show optimism near the pre-COVID levels. Overall, investors are sitting on a fence, seen by the Fear & Greed Index from CNN Money[2].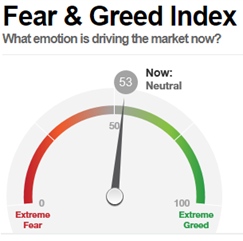
In our conversations with clients, we have been hearing variations of two major concerns—Isn’t the market too high, and what about inflation?
As many “experts” dismiss such trepidation and revel in a Roaring ’20s repeat, some warn that the recovery so far is flimsy, built on massive fiscal and monetary stimulus and astronomical leverage that present the mirage of a fast-improving economy.
Cumulatively, the COVID emergency response is an extraordinary five times the size of the FDR 1930’s New Deal and four times the size of the quantitative easing program after the Great Recession in 2008 (in 2020 dollars). It compares similarly on a per capita basis.
A recent study from Deutsche Bank portrayed these figures in terms of GDP output gaps. This economic term compares the difference in the actual GDP versus potential GDP. In other words, it is a widely used metric in measuring the impact on the economy from a particular event or market cycle.
The output gap in the 1930s was 10 times larger than today and five times larger than the Financial Crisis[3]. So, relative to the respective output gaps, the fiscal injections of the past decade look much more aggressive than that seen almost a century ago. U.S. money supply growth is currently growing at 27% year-over-year, whereas it had sharply declined in the 1930s, and equity markets are also in a completely different place today.
Perhaps even more astonishing—all these figures are before the new $2 trillion infrastructure package and omit the some $100 billion in remaining PPP funds.
Nervousness seems to be the only reasonable reaction to a central bank and federal government who appear to be in cahoots to spend as if there is no tomorrow. Economically speaking, growth of the money supply is paid for by future inflation, traditionally measured by the CPI (Consumer Price Index). The eerie absence of inflation is unsettling, but not without explanation.
It is important to remember that economics, while classified as a science, primarily deals in theory. And the Federal Reserve has changed their approach a few times over the last century. Today, Modern Monetary Theory has become all the rage. The central tenet of MMT is that sovereign nations like the U.S., who issue their own currency, can never default. Hence, deficits mean absolutely nothing in the short run, and maybe even in the long run.
Unfortunately, the MMT school of thought agrees with most economists that financial asset price inflation is not part of inflation. This supports the theory that sovereign nations can print an infinite amount of money—since there is “no inflation,” presumably there is no harm done.
But the correlation between the performance of the stock market and monetary stimulus has long surpassed coincidental, seen in the chart from Seeking Alpha.

The last time the Federal Reserve reduced their money printing activities was during the shaded area labeled as “QT” (quantitative tightening). While almost indistinguishable on the Fed’s balance sheet (the blue line), the market reacted harshly, pulling back almost 20% from September through Christmas Eve of 2018.
This may be a harbinger of what is to come. The COVID economy has prompted the Federal Reserve to launch into “QE Infinity,” and unsurprisingly, the stock market has followed suit. This is where the Goldilocks metaphor starts to crumble—getting the next step “just right” will prove difficult.
So, we are adopting a new, more practical mantra: “Dance While the Music is Still Playing.”
The Tax Man Cometh
The past few years have presented a large opportunity for tax planning since the Tax Cuts and Jobs Act was enacted in 2018. The reason is simple—there is considerable room for most Americans to take advantage of an historically low tax bracket.

The expansion of the 24% bracket has approximately doubled the amount of income a taxpayer can have taxed at 25% or less. This is an important metric because tax-free Roth retirement contributions win the long-term battle over tax-deferred traditional retirement contributions when future tax rates are higher than today. The same can be said of conversions.
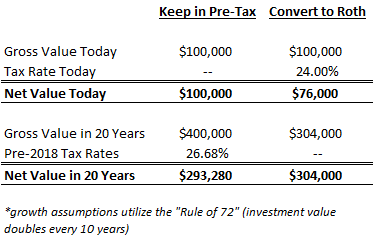
In the example to the right, a married taxpayer would be able to convert $100,000 into a Roth IRA, even if adjusted gross income was up to $215,000, and stay in this bracket. The assumption for the pre-tax investor is that tax rates revert to their pre-2018 levels.
Perhaps most compelling about this strategy is that it does not have to be a Roth conversion to work as described; as long as the source of funds was within the 24% tax bracket, the Roth strategy wins. This means that for joint filers, if your adjusted gross income is under $315,000 it may make sense to max out as much as possible in Roth contributions. Some employers offer Roth 401(k) options and backdoor Roth strategies are advisable for those over the income limit.
Furthermore, the degree to which the “keep in pre-tax” investor loses out is in direct correlation to the future tax rate (the inverse is also true). With the recent moves in monetary policy and fiscal stimulus, most Americans are wary of tax rates going up in the future to pay for some of the spending. While we cannot predict the future, Roth strategies at the very least represent a tax hedge. A diversified portfolio typically refers to investment and volatility risk, but tax diversification should also be a primary consideration for investors today.
Zoom Town, USA
The COVID-19 epidemic has prompted historical comparisons from every conceivable angle—the economy, stock market, public health policy, unemployment, and so forth. We thought we had heard them all until NPR’s Planet Money podcast compared COVID-19 to the California Gold Rush of the mid-19th century.
In 1849, tens of thousands of prospectors and their families made the journey west in search of gold. Americans were pouring into new communities for the mining prospects, high-paying jobs, attractive amenities, and other opportunities. Newcomers were drawn by high salaries or the prospect of striking it rich in mining, while numerous indirect businesses developed to cater to workers. The result was America’s first real experience with “boomtowns,” typically characterized by rapid expansions in both population and money.
A year after the dawn of COVID, one of the lasting effects appears to be on the workplace. A new Gallup poll found that most U.S. workers (56%, to be exact) were “always” or “sometimes” working remotely as of January 2021. Much to their delight, CEOs and business owners are realizing that remote work can be even more productive than the traditional, in-office alternative. So much so, that American corporations spent 25% more in 2020 on computers and technological equipment than in the year prior[4]. With a renewed sense regarding the meaning of work, Americans are on a crusade to create the modern boomtown—the Zoom town.
The median existing home price has increased 11.2% in year ended in January, the highest rise since February 2006[5]. Many small rural towns, suburban areas, and vacation destinations saw increases of more than double the national average. This appears to be a nationwide phenomenon where almost every major metropolis is seeing shortfalls in rental demand coupled with surging suburban home prices. As remote work becomes more accepted, this may not be an accident.
The unfortunate reality of this is that it suggests a “K-shaped recovery.” The rising, top-right part of the “K” is the America that is buying new homes or that already owns one and is seeing its value increasing. Those Americans have stock portfolios and retirement accounts that have been doing shockingly well. And they have good jobs that they can remote into with safety and flexibility. The descending, bottom-right part of the “K” is the America that is showing up in record-high unemployment numbers and mounting bankruptcy statistics. It is the America that rents, has huge student loans, no retirement savings, and is now dependent on the government or family for an affordable place to live.
The boomtowns of the California Gold Rush ultimately turned into ghost towns once the resources of the area were depleted. Zoom towns may have a similar story—once the world returns “back to normal,” the cost-benefit of a remote lifestyle changes. It seems unlikely, however, that the workplace will revert to its prior form, as structural changes are being made to accommodate remote work as a much larger part of the American ethos.
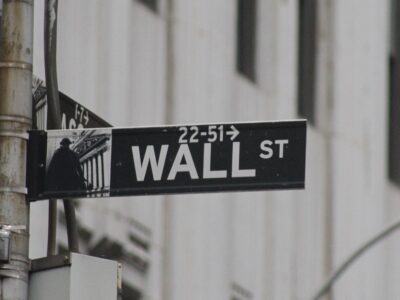
The “ghost town” analogy appears more apt for large metropolis areas, as anyone who has been on Market Street in Philadelphia recently can attest. High earners, the middle class, millennials, and families are leaving city centers in droves. Areas such as Manhattan and San Francisco, which saw real estate at all-time highs pre-COVID, are seeing stagnant if not decreasing real estate prices during the fastest real estate price increase nationwide in the last 15 years.
Ed Glaeser, Harvard economist and author of the book “Triumph of the City,” was once quoted as saying that “the city is humanity’s greatest invention.” To remain relevant, the city may need to reinvent itself.
We hope you enjoyed our comments. If you have any questions, please do not hesitate to contact us. We welcome the opportunity to discuss our thoughts in greater detail. Thank you for your continued confidence in Planning Capital.
[1] Carleton English, “Highlights from Jamie Dimon’s Annual Letter,” Barron’s, April 7, 2021
[2] The Fear & Greed Index, CNN Money, April 15, 2021, https://money.cnn.com/data/fear-and-greed/
[3] Matt Topley, “Topley’s Top 10,” View from the Top, April 15, 2021
[4] Riding High, A Special Report on the Future of Work, The Economist, April 16, 2021
[5] John Bazemore, “U.S. Home Prices Rise at Fastest Pace in 15 Years,” The Wall Street Journal, March 30, 2021